FX OSINT - Institutional Midnight Intelligence For ForexFX OSINT — Institutional Midnight Intelligence For Forex
See Your FX Charts Like an Intelligence Briefing, Not a Guess
If you’ve ever stared at EURUSD or GBPJPY and thought:
Where is the real liquidity?
Is this move sponsored by smart money or just noise?
Am I buying into premium or discount?
…then FX OSINT is designed for you.
FX OSINT (Forex Open Source Intelligence) treats the FX market the way an analyst treats an investigation:
Collect open‑source signals from price, time, and volatility.
Map out liquidity, structure, and sessions in a repeatable way.
Present them in a clean, non‑cluttered dashboard so you can read context quickly.
No rainbow spaghetti. No 12 indicators stacked on top of each other. Just structured information, midnight visuals, and a clear read on what the market is doing right now.
Why FX OSINT Exists
Many FX traders run into the same problems:
Overloaded charts – multiple indicators fighting for space, none talking to each other.
Signals with no context – arrows that ignore structure, sessions, and liquidity.
Tools not tuned for FX – generic indicators that don’t care what pair you are on.
FX OSINT brings this together into one FX‑focused framework that:
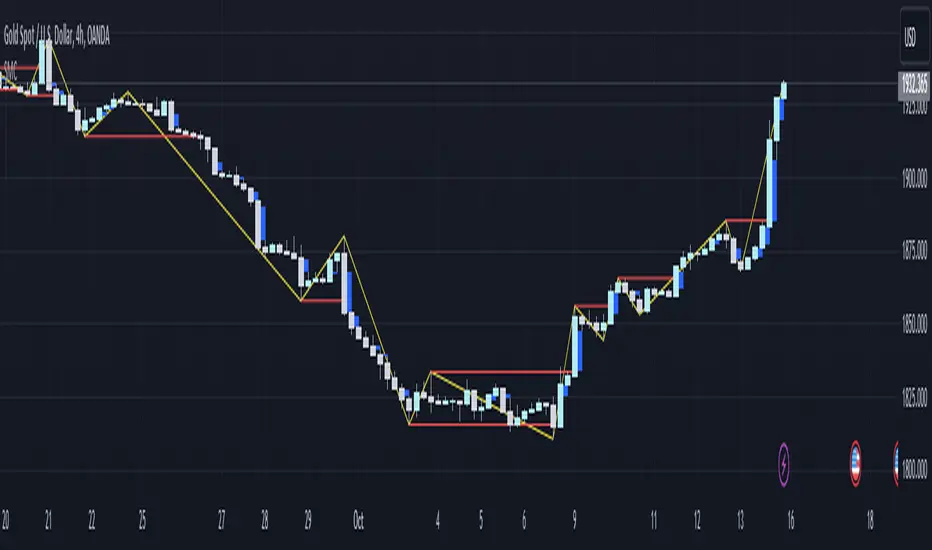
Understands structure : BOS/CHOCH, swings, and trend across multiple timeframes.
Respects liquidity : sweeps, order blocks, and FVGs with controlled visibility.
Reads volatility & ADR : how far today’s range has developed.
Knows the clock : London, New York, and key killzones.
Scores confluence : a 0–100 engine that summarizes how much is lining up.
FX OSINT is built for traders who want structured, institutional‑style logic with a disciplined, midnight‑themed UI —not flashing buy/sell buttons.
1. Midnight Dashboard — Top‑Right Intelligence Panel
This panel acts as your compact “situation room”:
CONFLUENCE — 0–100 score blending trend alignment, volatility regime, sessions, liquidity events, order blocks, FVGs, and ADR context.
REGIME — Low / Building / Normal / Expansion / Extreme, driven by ATR relationships, so you know if you’re in chop, trend, or expansion.
HTF / MTF / LTF TREND — Higher‑, medium‑, and current‑timeframe bias in one place, so you see if you are trading with or against the larger flow.
ADR USED — How much of today’s typical range has already been consumed in percentage terms.
PIP VALUE — Approximate pip size per pair, including JPY‑style pairs.
Everything is bold, legible, and color‑coded, but the layout stays minimal so you can:
Look once → understand the context.
2. Structure, BOS, CHOCH — Smart‑Money‑Style Skeleton
FX OSINT tracks swing highs and lows, then shows how structure evolves:
Trend logic based on evolving swings, not just a moving average cross.
BOS (Break of Structure) when price expands in the direction of trend.
CHOCH (Change of Character) when behavior flips and the market structure changes.
Labels are selective, not spammy . You don’t get a tag on every minor wiggle—only when structure meaningfully shifts, so it’s easier to answer:
"Are we continuing the current leg, or did something actually change here?"
3. Liquidity Sweeps, Order Blocks & FVGs — The OSINT Layer
FX OSINT treats liquidity as a key information layer:
Liquidity sweeps — Detects when price spikes through recent highs/lows and then snaps back, flagging potential stop runs.
Order blocks — The last opposite candle before a displacement move, drawn as controlled boxes with limited lifespan to avoid clutter.
Fair Value Gaps (FVGs) — Three‑candle imbalances rendered as precise zones with a cap on how many can exist at once.
Under the hood, boxes are managed so your chart does not become a wall of old zones:
// Draw Order Blocks with overlap prevention
if isBullishOB and showOrderBlocks
if array.size(obBoxes) >= maxBoxes
oldBox = array.shift(obBoxes)
box.delete(oldBox)
newBox = box.new(bar_index , low , bar_index + obvLength, high ,
border_color = bullColor, bgcolor = bullColorTransp,
border_width = 2, extend = extend.none)
array.push(obBoxes, newBox)
Box limits keep the number of zones under control.
Borders and transparency are tuned so you still see price clearly.
You end up with a curated liquidity map , rather than a chart buried under every level price has ever touched.
4. Volatility, ADR & Sessions — Time and Range Intelligence
FX OSINT runs a Volatility Regime Analyzer and an ADR engine in the background:
Volatility regime — Five states (Low → Extreme) derived from fast vs. slow ATR.
ADR bands — Daily high/mid/low projected from the current daily open.
ADR used % — How far today’s move has traveled relative to its typical range.
On the time side:
Asia, London, New York sessions are softly highlighted with a single active background to avoid overlapping colors.
Killzones (e.g., London and New York opens) can be emphasized when you want to focus on where significant moves often begin.
Together, this helps you answer:
"What time is it in the trading day?"
"How stretched are we?"
"Is expansion just starting, or are we late to the move?"
5. ICT‑Style Add‑Ons — BOS/CHOCH, Premium/Discount, and Confluence
For modern FX / ICT‑inspired workflows, FX OSINT includes:
BOS / CHOCH labels — Clear structural shifts based on swings.
Premium / Discount zones — 25%, 50%, 75% levels of the daily range, so you know if you are buying discount in an uptrend or selling premium in a downtrend.
Confluence score — A single number summarizing how many conditions line up in the current context.
Instead of replacing your plan, FX OSINT compresses your checklist into the chart:
Structure
Liquidity
Session / Time
Volatility / ADR
Higher‑timeframe alignment
When these agree, the dashboard reflects it. When they don’t, it stays neutral and lets you see the conflict.
How To Use FX OSINT
FX OSINT is not a signal bot. It is an information engine that organizes context so you can apply your own plan.
A typical workflow might look like:
Start on higher timeframes (e.g., H4/D1) to form directional bias from structure, volatility regime, and ADR context.
Move to intraday timeframes (e.g., M15/H1) around your chosen sessions (London and/or New York).
Look for confluence :
HTF / MTF / LTF trends aligned.
Price in discount for longs or premium for shorts.
Recent liquidity sweep into a meaningful OB or FVG.
Confluence score at or above a level you consider significant.
Then refine entries using BOS/CHOCH on lower timeframes according to your own risk and execution rules.
FX OSINT aims to make sure you do not enter a trade without seeing:
Where you are in the day (ADR and sessions).
Where you are in the volatility cycle (regime).
Who currently appears in control (structure and trend).
Which liquidity was just targeted (sweeps and zones).
Design Choices and Scope
FX OSINT was designed around a few clear constraints:
FX‑focused — Logic and filters tuned for FX majors, minors, exotics, and metals. It is intended for FX markets, not for every possible asset class.
Open‑source — The full Pine Script code is available so you can read it, learn from it, and adapt it to your own workflow if needed.
Clear themes — Two main visual styles (e.g., dark institutional “midnight” and a lighter accent variant) with a focus on readability, not visual noise.
Chart‑friendly — Panels use fixed areas, session highlights avoid overlapping, and boxes are capped/pruned so the chart remains usable.
FX OSINT is for only Forex pairs, not anything else!
Hope you enjoyed and remember your Open Source Intelligence Matters 😉!
-officialjackofalltrades
Wyszukaj w skryptach "smart money"

ICT Fair Value Gap (FVG) Detector │ Auto-Mitigated │ 2025Accurate ICT / Smart Money Concepts Fair Value Gap (FVG) detector
Features:
• Detects both Bullish (-FVG) and Bearish (+FVG) using strict 3-candle rule
• Boxes automatically extend right until price mitigates them
• Boxes auto-delete when price closes inside the gap (true mitigation)
• No repainting – 100% reliable
• Clean, lightweight, and works on all markets & timeframes
• Fully customizable colors and transparency
How to use:
– Bullish FVG (green) = potential support / buy zone in uptrend
– Bearish FVG (red) = potential resistance / sell zone in downtrend
Exactly matches The Inner Circle Trader (ICT) methodology used by thousands of SMC traders in 2024–2025.
Enjoy and trade safe!

VWAP + Volume Spikes See Where Smart Money ExhaustsVolume tells the truth. VWAP tells the bias. This script shows both — live.
If you trade intraday momentum, reversals, or liquidity sweeps, this indicator is built for you.
It shows where volume spikes hit extreme levels, anchored around VWAP and its dynamic bands, so you can instantly spot capitulation or hidden absorption.
🎯 What This Indicator Does
✅ Plots VWAP — session-anchored, updates automatically
✅ Adds dynamic VWAP bands — standard deviation envelopes showing volatility context
✅ Highlights volume spikes — colored candles + background for abnormal prints
✅ Includes alerts — “Volume Spike”, “VWAP Cross”, or a combined alert with direction
✅ Clean visual design — instantly readable in fast markets
It’s your visual orderflow radar — whether you’re trading gold, indices, or small caps.
🔍 Why It Works
Institutions build and unwind positions around VWAP.
Retail often chases volume… this script shows you when that volume becomes too extreme.
A spike above VWAP near resistance? → Likely distribution.
A spike below VWAP near support? → Likely capitulation.
Combine volume exhaustion + VWAP context, and you’ll see market turning points form before most indicators react.
⚙️ Inputs You Can Tune
Bands lookback: adjusts how reactive the VWAP bands are
Band width (σ): set how tight or wide your deviation envelope is
Volume baseline length: controls how “abnormal” a spike must be
Spike threshold: multiplier vs. average volume
Toggle color-coding, bands, and labels
Default settings work well across 1m–15m intraday charts and 1h–4h swing frames.
💡 How Traders Use It
1️⃣ Fade Parabolics:
When a green spike candle pierces upper VWAP band on high volume → smart money unloading.
Look for rejection and short into VWAP.
2️⃣ Catch Capitulations:
When a red spike candle dumps below lower VWAP band → panic selling.
Watch for stabilization and long back to VWAP.
3️⃣ VWAP Rotation Plays:
Alerts for price crossing VWAP help you spot shift in intraday control.
Above VWAP = buyers in charge.
Below VWAP = sellers in charge.
🧠 Best Practices
Pair it with Volume Profile or Delta/Flow tools to confirm exhaustion.
Don’t chase — wait for spike confirmation + reversal candle.
Use it on liquid tickers (NASDAQ, SPY, GOLD, BTC, etc.).
Great for Dux-style small-cap shorts or index pullbacks.
🔔 Alerts Ready
Choose from:
Volume Spike (single-bar explosion)
VWAP Cross Up/Down (trend shift confirmation)
One Combined Alert (any signal, includes ticker, price, and volume)
Set once — get real-time push notifications, Telegram, or webhook signals.
📊 My Favorite Setups
US100 / NASDAQ: fade rallies above VWAP + spike
Gold / Silver: trade reversals from VWAP bands
Small caps: short back-side after volume climax
ES, DAX, Oil: scalp VWAP rotation with confluence
❤️ Support This Work
I release free and premium scripts weekly — combining smart money concepts, VWAP tools, and volume analytics.
👉 Follow me on TradingView for more indicators and setups.
👉 Comment “🔥” if you want me to post the multi-timeframe VWAP + Volume Pressure version next.
👉 Share this with your team — it helps the community grow.

TrendSync Pro (SMC)📊 TrendSync Pro (SMC) – Advanced Trend-Following Strategy with HTF Alignment
Created by Shubham Singh
🔍 Strategy Overview
TrendSync Pro (SMC) is a precision-based smart trend-following strategy inspired by Smart Money Concepts (SMC). It combines: Real-time pivot-based trendline detection
Higher Time Frame (HTF) filtering to align trades with dominant trend
Risk management via adjustable Stop Loss (SL) and Take Profit (TP)
Directional control — trade only bullish, bearish, or both setups
Realistic backtesting using commissions and slippage
Pre-optimized profiles for scalpers, intraday, swing, and long-term traders
🧠 How It Works:
🔧 Strategy Settings Image:
beeimg.com
The strategy dynamically identifies trend direction by using swing high/low pivots. When a new pivot forms: It draws a trendline from the last significant pivot
Detects whether the trend is up (based on pivot lows) or down (based on pivot highs)
Waits for price to break above/below the trendline
Confirms with HTF price direction (HTF close > previous HTF close = bullish)
Only then it triggers a long or short trade
It exits either at TP, SL, or a manual trendline break
🛠️ Adjustable Parameters:
Trend Period: Length for pivot detection (affects sensitivity of trendlines)
HTF Timeframe: Aligns lower timeframe entries with higher timeframe direction
SL% and TP%: Customize your risk-reward profile
Commission & Slippage: Make backtests more realistic
Trade Direction: Choose to trade: Long only, Short only, or Both
🎛️ Trade Direction Control:
In settings, you can choose: Bullish Only: Executes only long entries
Bearish Only: Executes only short entries
Both: Executes both long and short entries when conditions are met
This allows you to align trades with your own market bias or external analysis.
📈 Entry Logic: Long Entry:
• Price crosses above trendline
• HTF is bullish (HTF close > previous close)
• Latest pivot is a low (trend is considered up)
Short Entry:
• Price crosses below trendline
• HTF is bearish (HTF close < previous close)
• Latest pivot is a high (trend is considered down)
📉 Exit Logic: Hit Take Profit or Stop Loss
Manual trendline invalidation: If price crosses opposite of the trend direction
⏰ Best Timeframes & Recommended Settings:
Scalping (1m to 5m):
HTF = 15m | Trend Period = 7
SL = 0.5% | TP = 1% to 2%
Intraday (15m to 30m):
HTF = 1H | Trend Period = 10–14
SL = 0.75% | TP = 2% to 3%
6 Hour Trading (30m to 1H):
HTF = 4H | Trend Period = 20
SL = 1% | TP = 4% to 6%
Swing Trading (4H to 1D):
HTF = 1D | Trend Period = 35
SL = 2% | TP = 8% to 12%
Long-Term Investing (1D+):
HTF = 1W | Trend Period = 50
SL = 3% | TP = 15%+
Note: These are recommended base settings. Adjust based on volatility, asset class, or personal trading style.
📸 Testing Note:
beeimg.com
TradingView limits test length to 20k bars (~40 trades on smaller timeframes). To show long-term results: Test on higher timeframes (e.g., 1H, 4H, 1D)
Share images of backtest result in description
Host longer test result screenshots on Imgur or any public drive
📍 Asset Behavior Insight:
This strategy works on multiple assets, including BTC, ETH, etc.
Performance varies by trend strength:
Sometimes BTC performs better than ETH
Other times ETH gives better results
That’s normal as both assets follow different volatility and trend behavior
It’s a trend-following setup. Longer and clearer the trend → better the results.
✅ Best Practices: Avoid ranging markets
Use proper SL/TP for each timeframe
Use directional filter if you already have a directional bias
Always forward test before going live
⚠️ Trading Disclaimer:
This script is for educational and backtesting purposes only. Trading involves risk. Always use risk management and never invest more than you can afford to lose.

Hybrid Smart Money Concepts [MarkitTick]💡This indicator provides a comprehensive technical analysis system that combines Market Structure concepts (Smart Money Concepts) with advanced Gap Analysis and a statistical Stress Model. It is designed to help traders identify trend direction, structural pivot points, potential reversal zones (Order Blocks), significant price gaps, and moments of market exhaustion.
Unlike standard ZigZag or Fractal indicators, this script integrates volume, trend maturity, and statistical volatility (Z-Score) to contextually classify price action. By overlaying these elements with a robust Market Structure engine—which identifies Change of Character (CHoCH) and Order Blocks—the tool provides a confluent view of price action.
It automates the detection of institutional footprints, allowing traders to see the structural trend, momentum drivers, and potential exhaustion points simultaneously.
● METHODOLOGY
The script operates on three distinct but complementary logic engines:
• Gap Analysis Engine
This module detects gaps between the previous high/low and the current open. It classifies them into three specific types based on volume and structural context:
Breakaway Gaps: Identified when a gap creates a breakout above a recent Pivot High or below a Pivot Low. This signals the start of a potential new trend.
Exhaustion Gaps: Identified when a gap occurs with high relative volume and meets the Trend Maturity criteria. This often signals the end of a trend.
Runaway Gaps: Standard continuation gaps that occur within a trend.
• Market Structure Engine
Swings and CHoCH: The script uses a left-and-right bar lookback to identify Pivot Highs and Lows. A Change of Character (CHoCH) is plotted when price closes beyond the most recent major pivot.
Order Blocks (OB): Upon a continuation of the trend, the script scans backward to find the extreme candle (the origin of the move) and highlights this zone as an Order Block.
Dynamic Cleanup: Gaps and Order Blocks are automatically removed (mitigated) when price aggressively crosses through their levels.
• Exhaustion & Stress Model
This statistical engine measures market "Stress" by analyzing the impact of price range relative to volume (True Range / Volume).
Calculation: It calculates a Z-Score (Standard Deviation) of this impact.
Logic: When the Z-Score exceeds a specific threshold (Sigma), it indicates a statistical anomaly or "Stress."
Signal: If high stress occurs while price is significantly above the trend baseline, it signals "Buyer Exhaustion." Conversely, high stress below the baseline signals "Seller Exhaustion."
● VISUALS & LEGEND
Before trading, you need to know what the indicator is drawing on your chart:
• Change of Character (CHoCH)
Green Dashed Line: Indicates a Bullish reversal.
Red Dashed Line: Indicates a Bearish reversal.
• Order Blocks (OB)
Green Boxes: Bullish support zones (Buy interest).
Red Boxes: Bearish resistance zones (Sell interest).
Note: Invalidated boxes are automatically deleted.
• Gaps
Blue Box (Breakaway): Strong momentum gap starting a new trend.
Orange Box (Runaway): Continuation gap.
Red Box (Exhaustion): Warning signal; trend may be ending.
• Stress Model Signals
Label "BE" (Red): Buyer Exhaustion. Suggests the bullish move is overextended relative to volume participation.
Label "SE" (Green): Seller Exhaustion. Suggests the bearish move is overextended.
● TRADING STRATEGY
You can use a "Pullback, Continuation & Exhaustion" strategy with this indicator.
• Scenario A: Long Setup (Buying)
Trend Change: Look for a CHoCH label with a Green Dashed Line.
Entry Zone: Look for a Green Order Block (OB) to form.
Confirmation: A Breakaway Gap (Blue) validates the breakout.
Entry: Enter Long when price pulls back into the Green OB.
Exit Warning: If a "BE" (Buyer Exhaustion) label appears, consider tightening stops or taking profit.
• Scenario B: Short Setup (Selling)
Trend Change: Look for a CHoCH label with a Red Dashed Line.
Entry Zone: Look for a Red Order Block (OB) to form.
Confirmation: A Breakaway Gap downwards validates the move.
Entry: Enter Short when price rallies back into the Red OB.
Exit Warning: If an "SE" (Seller Exhaustion) label appears, consider tightening stops or taking profit.
● SETTINGS
• Date Range Filter
Use Date Filter: Toggle time-based filtering.
Start Date: Timestamp to begin calculations.
• Gap Analysis
Min Gap Size: Minimum points required to register a gap.
Logic Inputs: Configures lookback periods and volume multipliers for gap classification.
Visuals: Customize colors for Breakaway, Runaway, and Exhaustion gaps.
• Market Structure
Swing Detection Length: Lookback period for pivot points.
Show CHoCH: Toggle for Change of Character labels.
Show Order Blocks: Toggle for OB boxes.
• Exhaustion & Stress Model
Trend Filter Length: Baseline length for determining trend direction (EMA).
Statistical Lookback: Length for the Z-Score calculation.
Stress Threshold (Sigma): The standard deviation requirement to trigger an exhaustion signal (Default: 2.0).
● DISCLAIMER
All provided scripts and indicators are strictly for educational exploration and must not be interpreted as financial advice or a recommendation to execute trades. I expressly disclaim all liability for any financial losses or damages that may result, directly or indirectly, from the reliance on or application of these tools. Market participation carries inherent risk where past performance never guarantees future returns, leaving all investment decisions and due diligence solely at your own discretion.

Delta Zones Smart Money Concept (SMC) UT Trend Reversal Mul.Sig.🚀 What's New in This Version (V5 Update)
This version is a major overhaul focused on improving trade entry timing and risk management through enhanced UT Bot functionality:
Integrated UT Trailing Stop (ATR-based): The primary trend filter and moving stop-loss mechanism is now fully integrated.
Pre-Warning Line: A revolutionary feature that alerts traders when the price penetrates a specific percentage distance (customizable) from the UT Trailing Stop before the main reversal signal fires.
"Ready" Signal: Plots a "Ready" warning label on the chart and triggers an alert condition (UT Ready Long/Short) for pre-emptive trade preparation.
V5 Compatibility: All code has been optimized for Pine Script version 5, utilizing the modern array and type structures for efficient Order Block and Breaker Block detection.
💡 How to Use This Indicator
This indicator works best when confirming signals across different components:
1. Identify the Trend Bias (UT Trailing Stop)
Uptrend: UT Trailing Stop line is Green (Focus only on Buy/Long opportunities).
Downtrend: UT Trailing Stop line is Red (Focus only on Sell/Short opportunities).
2. Prepare for Entry (Warning Line)
Action: When you see the "Ready" label or the price hits the Pre-Warning Line (Dotted Orange Line), this is your alert to prepare for a trend flip, or to tighten the stop on your current trade.
3. Confirm the Entry (Multi-Signals)
Look for a primary entry signal that aligns with the desired trend:
High-Conviction Entry: Wait for the UT Buy/Sell label (confirmed trend flip) AND a Combined Buy/Sell arrow (confirmed by your selected Oscillator settings).
High-Liquidity Entry: Look for a Delta Zone Box forming near an active Order Block or Breaker Block (SMC zones), and then confirm with a UT or Combined Signal.
4. Manage Risk (Trailing Stop)
Always set your initial Stop Loss (SL) either just outside the opposite Order Block or at the UT Trailing Stop level itself.
If the price closes back across the UT Trailing Stop, exit your position immediately, as the trend bias has officially shifted.
Features & Components
1. Delta Zones (Liquidity/Wick Pressure)
Identifies periods of extreme buying or selling pressure based on wick-to-body ratios and standard deviation analysis.
Plots colored pressure boxes (Buy/Sell) to highlight potential exhaustion points or institutional activity.
2. Smart Money Concepts (SMC)
Automatically detects and plots Order Blocks (OBs) and Breaker Blocks (BBs) based on confirmed Market Structure Breaks (MSBs).
Includes Chop Control logic to remove less reliable Breaker Blocks.
3. UT Bot Trailing Stop & Warning Line
UT Trailing Stop (ATR-based): Plots a dynamic trend line (Green/Red) that acts as a moving stop-loss and primary trend filter.
Ready/Warning Signals: Alerts traders (via the "Ready" label and orange lines) when the price enters a "Pre-Reversal Zone" near the Trailing Stop.
4. Multi-Indicator Confirmation (Filters)
Includes customizable signals based on the crossover/crossunder of RSI, CCI, and Stochastic indicators against configurable Overbought/Oversold levels.
Allows selection of combination signals (e.g., RSI & CCI, All Combined, etc.) for high-conviction entries.

ETH Smart Money Order Blocks Detector derek
This script helps identify potential Order Blocks (institutional price zones) on the chart based on Breaks of Structure (BOS).
It automatically highlights demand zones (green blocks) and supply zones (red blocks), making it easier to read institutional market flow.
Ideal for traders using Smart Money Concepts (SMC) or market structure analysis.
Compatible with any asset and timeframe.
🔹 Bullish OB = potential buy entry zone
🔹 Bearish OB = potential sell or resistance zone
Author: Derek 🧠💹

FVG Candle HighlighterThis indicator highlights only the true Fair Value Gap (FVG) creator candle — the middle candle in a 3-bar FVG formation — with zero clutter.
🔹 Bullish FVG: Candle is colored if price gaps above the high two bars back
🔹 Bearish FVG: Candle is colored if price gaps below the low two bars back
✨ No boxes. No zones. Just pure, visual price-action accuracy.
🔧 Powered by Pine Script v6
🧠 Based on institutional-style FVG logic
🎯 Ideal for Smart Money / ICT / Order Block strategies

SMT Divergence ICT 01 [TradingFinder] Smart Money Technique🔵 Introduction
SMT Divergence (short for Smart Money Technique Divergence) is a trading technique in the ICT Concepts methodology that focuses on identifying divergences between two positively correlated assets in financial markets.
These divergences occur when two assets that should move in the same direction move in opposite directions. Identifying these divergences can help traders spot potential reversal points and trend changes.
Bullish and Bearish divergences are clearly visible when an asset forms a new high or low, and the correlated asset fails to do so. This technique is applicable in markets like Forex, stocks, and cryptocurrencies, and can be used as a valid signal for deciding when to enter or exit trades.
Bullish SMT Divergence : This type of divergence occurs when one asset forms a higher low while the correlated asset forms a lower low. This divergence is typically a sign of weakness in the downtrend and can act as a signal for a trend reversal to the upside.
Bearish SMT Divergence : This type of divergence occurs when one asset forms a higher high while the correlated asset forms a lower high. This divergence usually indicates weakness in the uptrend and can act as a signal for a trend reversal to the downside.
🔵 How to Use
SMT Divergence is an analytical technique that identifies divergences between two correlated assets in financial markets.
This technique is used when two assets that should move in the same direction move in opposite directions.
Identifying these divergences can help you pinpoint reversal points and trend changes in the market.
🟣 Bullish SMT Divergence
This divergence occurs when one asset forms a higher low while the correlated asset forms a lower low. This divergence indicates weakness in the downtrend and can signal a potential price reversal to the upside.
In this case, when the correlated asset is forming a lower low, and the main asset is moving lower but the correlated asset fails to continue the downward trend, there is a high probability of a trend reversal to the upside.
🟣 Bearish SMT Divergence
Bearish divergence occurs when one asset forms a higher high while the correlated asset forms a lower high. This type of divergence indicates weakness in the uptrend and can signal a potential trend reversal to the downside.
When the correlated asset fails to make a new high, this divergence may be a sign of a trend reversal to the downside.
🟣 Confirming Signals with Correlation
To improve the accuracy of the signals, use assets with strong correlation. Forex pairs like OANDA:EURUSD and OANDA:GBPUSD , or cryptocurrencies like COINBASE:BTCUSD and COINBASE:ETHUSD , or commodities such as gold ( FX:XAUUSD ) and silver ( FX:XAGUSD ) typically have significant correlation. Identifying divergences between these assets can provide a strong signal for a trend change.
🔵 Settings
Second Symbol : This setting allows you to select another asset for comparison with the primary asset. By default, "XAUUSD" (Gold) is set as the second symbol, but you can change it to any currency pair, stock, or cryptocurrency. For example, you can choose currency pairs like EUR/USD or GBP/USD to identify divergences between these two assets.
Divergence Fractal Periods : This parameter defines the number of past candles to consider when identifying divergences. The default value is 2, but you can change it to suit your preferences. This setting allows you to detect divergences more accurately by selecting a greater number of candles.
Bullish Divergence Line : Displays a line showing bullish divergence from the lows.
Bearish Divergence Line : Displays a line showing bearish divergence from the highs.
Bullish Divergence Label : Displays the "+SMT" label for bullish divergences.
Bearish Divergence Label : Displays the "-SMT" label for bearish divergences.
🔵 Conclusion
SMT Divergence is an effective tool for identifying trend changes and reversal points in financial markets based on identifying divergences between two correlated assets. This technique helps traders receive more accurate signals for market entry and exit by analyzing bullish and bearish divergences.
Identifying these divergences can provide opportunities to capitalize on trend changes in Forex, stocks, and cryptocurrency markets. Using SMT Divergence along with risk management and confirming signals with other technical analysis tools can improve the accuracy of trading decisions and reduce risks from sudden market changes.

Introducing the "Smart Money Trap" (SMT) IndicatorThe "Smart Money Trap" (SMT) indicator is a powerful tool designed for simultaneous analysis of multiple currency pairs and their correlations. This indicator allows you to effortlessly visualize divergences and correlations between various currency pairs on a single chart, enhancing your ability to perform in-depth technical analysis.
Key Features:
Multi-Currency Comparison:
The SMT indicator enables you to view the following currency pairs simultaneously:
EUR/USD (Euro to US Dollar)
GBP/USD (British Pound to US Dollar)
USD/JPY (US Dollar to Japanese Yen)
DXY (US Dollar Index)
Correlation and Divergence Analysis:
By overlaying these currency pairs, the SMT indicator helps you identify correlations and divergences between them, which can signal potential trading opportunities.
Customizable Timeframes:
The indicator automatically adjusts to the current chart’s timeframe, ensuring that your analysis is always in sync with the selected period.
Enhanced Decision-Making:
With the ability to visualize multiple currency pairs and their relationships, you can make more informed trading decisions and better understand market dynamics.
The SMT indicator is a valuable tool for traders looking to track and analyze currency pair interactions and identify trading signals based on their correlations and divergences.

ADR/AWR/AMR Average Daily+Weekly+Monthly Range[Traders Reality]Advanced ADR/AWR/AMR indicator created for Traders Reality community, as well as the greater trading community.
Thanks to the TR community discord guys: infernix, peshocore and xtech5192
Everything is modular and can be turned on/off, including a customisable table showing daily/weekly/monthly average pips/dollars.
If you just want the average daily range lines for example, you can just disable everything else. You can choose how many days to look back; as well as for weeks or months.
Check out Traders Reality on YouTube if you want to see this implemented as part of Tino's strategy that utilizes market manipulation, imbalances, times of day etc.
Price regularly reverses from ADR, making it one of the few highly valuable indicators in price action/smart money trading.

Price Swing Detection - Smart Money ConceptSince my own style is Smart Money Concept and these days I have seen a lot of my friends who are having trouble identifying structures for their indicators and strategies. I wrote this code so they could use it in their strategy . In fact, this type of structure, as one of the strongest technical structures, can increase the success of your strategy according to your personalization.
The script detects swings (i.e. significant highs and lows) in a financial instrument's price action over a specified period. The user can set the lookback period (number of candles to consider) and the colors of the lines representing bullish and bearish trends.
The script has two functions: detectSwing and pivot high. The detectSwing function calculates the swing highs and lows for the specified number of candles. The function uses the ta.highest and ta.lowest functions to find the highest and lowest prices, respectively, over the lookback period. The function also determines the swing state (high or low) of the current candle and returns the calculated swing values.
The pivot high function calculates the pivot high, which is an important step in detecting bullish structures in the market. If a new top (i.e. swing high) is found, the script updates the pivot high values and creates a line from the recent top to the last bar. The script also updates the trailing maximum values, which are used to extend the top extension line.
For Strategy :
The variable "trendDirection" in the code is used to keep track of the trend state, either bullish (up trend) or bearish (down trend), in the market. The variable is initialized to 0 which represents a downtrend. The value of this variable is updated later in the code based on the calculations of swing highs and lows, pivot crosses, and the trailing maximum. If a bullish structure is detected, the value of "trendDirection" is set to 1, indicating an uptrend.

Bodies X Wix Version of Smart Money Tools by makuchaku & eFeThis is the same Script as Super Fair Value Gaps / FVG /BoS / by makuchaku & eFe. Mine Should Default to Large Text instead of small. The Super Order Blocks I believe was meant to for you to find one of the many Smart Money tools such as turn on the Fair Value gap but leave the others off, or Turn on where the Break of Structure and leave the others off. The reason I believe this is because the default values for each of the structures were default colored (green for positive and red for negative) for all.
Mine has a different Color for every possible structure. As long as you can read with the larger text that I added, then you can create your own boxes positive for break of structure, rejection block, order blocks and fair value gaps for any time frame. The reason I did that is because There's only certain things I believe I will need to mark for myself in each time frame, and then from there You can stretch iyour own box out further in time because if price touches a fair value gap for example, the fair value gap should conyinue in time until at least 2 candles have filed the Fair valu gap going both directions. That's truly when the fair value gap should is mitigated and will from off the chart. However, If I knew How to add the code for that, I would.
Additionally, I have the Max Boxes per chart, so you should have the ability to see every OB, FVG,RJB, & BoS on the chart
I tried my hardest to create a colored border that was different from the box. But the way the original was coded was almost impossible to do. Because they defined each of the structures (FVG, OB, BoS, RJB) outer levels, when the outer levels connect via math in the code, then it joins all the outside lines for a rectangle. When creating a box, the coloe will always be the same as the border unfortunately. (Unless I replan this from the beginning)
I also Changed the default labels for reach structure from a hard to read gray to a white that pops out.
Also, chart indicators are a little large as well. Such as the cross, sideways cross, The green Triangle, and the white Diamond. You'll get used to it or you can change it as well.
Creating videos for students, you need something they can see.
So, I just wanted to ensure everything was a little more unique and easily usable when showing this to my students when I send them private videos for our weekly lessons. I'm trying to learn how to use the IPFS for THAT, (which i see has invaded PineScript) Hope this indicator helps.
If you're to borrow this, Just make sure you keep the authors in the name makuchaku & efe

golden smart entrySmart Money Concepts (SMC) is a trading methodology that focuses on understanding and following the behavior of institutional investors—often referred to as "smart money." The goal is to identify high-probability trade setups by analyzing how these large players move the market.
Smart Money Swing Strategy [All-in-One]# Pro Swing Trader 📈
A comprehensive swing trading indicator for TradingView that combines multiple confluence factors to identify high-probability trade setups with built-in risk management.
## 🎯 Overview
This indicator is designed for swing traders who want to catch momentum pullbacks with precision entries. It filters trades using multiple timeframe analysis, RSI zones, volume confirmation, and EMA trends to deliver only the highest-confidence setups.
### Key Features
✅ **Multi-Timeframe Confluence** - Confirms trades with higher timeframe analysis (Daily, 4H, etc.)
✅ **Smart Entry Signals** - Detects pullback-to-EMA reclaim patterns
✅ **Automatic Risk Management** - Calculates stops, targets, and R-multiples
✅ **Dynamic Stop Loss** - ATR trailing stop + break-even automation
✅ **Real-Time HUD Dashboard** - Live confluence scoring and trade metrics
✅ **Comprehensive Alerts** - Entry, TP1, TP2, and stop-loss notifications
✅ **Visual Trade Levels** - Clear on-chart stop-loss and take-profit lines
---
## 📊 How It Works
### Signal Logic
The indicator identifies two types of signals:
**Base Signals** (Small triangles):
- Price pulls back between Fast EMA and Slow EMA
- RSI is in the swing zone (40-60 by default)
- Price reclaims the Fast EMA with momentum
- Optional: Volume spike confirmation
**High-Confidence Signals** (Large triangles):
- All base signal criteria met
- Higher timeframe confirms the trend direction
- HTF RSI and slope alignment
- These are your primary trade signals
### Entry Conditions
#### Long Entry (🟢 HC L)
1. Fast EMA > Slow EMA (uptrend)
2. Previous candle closed between the EMAs (pullback)
3. Current candle crosses above and closes above Fast EMA (reclaim)
4. RSI between 40-60 (swing zone)
5. **HTF Confirmation**: Daily/4H price above EMA50, RSI > 50, positive slope
6. Optional: Volume > 1.5x 20-bar average
#### Short Entry (🔻 HC S)
1. Fast EMA < Slow EMA (downtrend)
2. Previous candle closed between the EMAs (pullback)
3. Current candle crosses below and closes below Fast EMA (reclaim)
4. RSI between 40-60 (swing zone)
5. **HTF Confirmation**: Daily/4H price below EMA50, RSI < 50, negative slope
6. Optional: Volume > 1.5x 20-bar average
---
## 🎛️ Settings & Parameters
### Trend Parameters
- **Fast EMA**: Default 20 - Quick trend detection
- **Slow EMA**: Default 50 - Major trend filter
- **Swing Lookback**: Default 10 - Bars to find swing high/low for stops
### RSI Settings
- **RSI Length**: Default 14
- **RSI Min**: Default 40 - Lower bound of swing zone
- **RSI Max**: Default 60 - Upper bound of swing zone
### Risk Management
- **Final TP Risk-Reward (R)**: Default 2.0 - Main profit target multiplier
- **TP1 R Multiple**: Default 1.0 - Partial profit target
- **Use Break-even Stop**: Move stop to entry after 1R profit
- **ATR Trailing Stop**: Dynamic stop based on ATR(14) x 2.0
### Filters
- **Require Volume Spike**: Optional volume confirmation filter
- **Use Higher TF Confirmation**: Enable multi-timeframe analysis
- **Higher TF**: Default "D" (Daily) - Can use 240 (4H), W (Weekly), etc.
---
## 📈 Dashboard (HUD)
The top-center dashboard shows real-time confluence status:
| Column | Meaning |
|--------|---------|
| **Trend** | Current trend direction (UP/DOWN/Flat) |
| **HTF** | Higher timeframe alignment (Bull/Bear/Flat) |
| **RSI Zone** | Is RSI in swing zone? (YES/NO) |
| **Volume** | Volume spike detected? (YES/NO) |
| **Signal** | Active signal type (HC LONG/HC SHORT/None) |
| **R Risk** | Current profit in R-multiples |
| **Stop** | Current stop-loss level |
| **TP1** | Partial take-profit status |
| **TP2** | Final take-profit status |
| **Conf %** | Overall confluence score (0-100%) |
### Confidence Score Breakdown
- **20%** - Trend present (up or down)
- **30%** - HTF confirmation aligned (or 15% if HTF off)
- **20%** - RSI in swing zone
- **10%** - Volume spike
- **20%** - High-confidence signal triggered
**Scoring**:
- 🟢 70%+ = High probability setup
- 🟡 40-69% = Moderate setup
- 🔴 <40% = Low probability
---
## 🔔 Alert Setup
The indicator includes 8 alert conditions:
### Entry Alerts
- **HC LONG ENTRY** - High-confidence long signal triggered
- **HC SHORT ENTRY** - High-confidence short signal triggered
### Profit Target Alerts
- **LONG TP1 Reached** - Hit partial profit (1R by default)
- **LONG Final TP Reached** - Hit final target (2R by default)
- **SHORT TP1 Reached** - Hit partial profit
- **SHORT Final TP Reached** - Hit final target
### Stop Loss Alerts
- **LONG Stop/BE/Trail Level Hit** - Long position stopped out
- **SHORT Stop/BE/Trail Level Hit** - Short position stopped out
### How to Set Up Alerts
1. Click "Add Alert" on TradingView
2. Choose this indicator from the dropdown
3. Select desired alert condition
4. Set alert to trigger "Once Per Bar Close"
5. Customize notification method (popup/email/webhook)
---
## 📋 Trading Workflow
### 1. Wait for High-Confidence Signal
Look for the large **HC L** or **HC S** triangle on chart close.
### 2. Verify Confluence
Check the HUD dashboard:
- Confidence score should be 70%+
- HTF status should show alignment
- RSI Zone should be "YES"
### 3. Entry
Enter the trade at market or on next candle open.
### 4. Set Stop Loss
Use the **initial stop** shown in the HUD (red line on chart):
- **Longs**: Below the swing low (10-bar lookback)
- **Shorts**: Above the swing high (10-bar lookback)
### 5. Set Take Profits
- **TP1**: 1R (50% position close) - Yellow line
- **TP2**: 2R (remaining 50% close) - Green line
### 6. Manage the Trade
- Monitor the **R Risk** column to track profit
- Stop moves to break-even automatically after 1R (if enabled)
- ATR trailing stop engages dynamically (red line adjusts)
- Exit if price hits dynamic stop level
---
## 🎨 Visual Guide
### On-Chart Elements
**Triangles**:
- Small lime/red triangles = Base signals (lower confidence)
- Large lime/red triangles = High-confidence signals (trade these!)
**Lines**:
- 🟢 Green line = Fast EMA (20)
- 🟠 Orange line = Slow EMA (50)
- 🔴 Red line = Dynamic stop-loss level
- 🟡 Yellow line = TP1 level
- 🟢 Green line = TP2 (final target)
**HUD Colors**:
- 🟢 Green = Bullish/Active/Good
- 🔴 Red = Bearish/Inactive/Warning
- 🟡 Yellow = Neutral/Caution
- 🔵 Blue = Informational
- ⚫ Gray = Disabled/Off
---
## 💡 Strategy Tips
### Best Practices
1. **Only trade High-Confidence signals** - Ignore base signals unless very experienced
2. **Respect the HTF** - Don't fight the higher timeframe trend
3. **Use proper position sizing** - Risk 1-2% of account per trade
4. **Partial profits work** - Take 50% off at TP1, let rest run to TP2
5. **Let winners run** - Trailing stop helps capture extended moves
6. **Be patient** - Quality over quantity; wait for 70%+ confluence
### Optimal Timeframes
- **Primary Chart**: 1H, 4H, Daily (swing trading)
- **HTF Setting**: One level higher than your chart
- If trading 1H → Set HTF to 4H or D
- If trading 4H → Set HTF to D or W
- If trading Daily → Set HTF to W
### Market Conditions
**Best Performance**:
- Trending markets with healthy pullbacks
- Clear support/resistance zones
- Moderate volatility
**Avoid Trading**:
- Extremely choppy/sideways markets
- Major news events (unless experienced)
- Low confidence scores (<40%)
---
## ⚙️ Advanced Customization
### Aggressive Setup (More Signals)
```
Fast EMA: 12
Slow EMA: 26
RSI Min: 35
RSI Max: 65
Use HTF Confirmation: OFF
Require Volume Spike: OFF
```
### Conservative Setup (Fewer, Higher Quality)
```
Fast EMA: 20
Slow EMA: 50
RSI Min: 45
RSI Max: 55
Use HTF Confirmation: ON
Require Volume Spike: ON
Final TP R: 3.0
```
### Scalping Adaptation (Not Recommended)
```
Fast EMA: 9
Slow EMA: 21
Swing Lookback: 5
TP1 R: 0.5
Final TP R: 1.0
```
---
## ⚠️ Risk Disclaimer
**IMPORTANT**: This indicator is for educational and informational purposes only.
- Past performance does not guarantee future results
- No indicator is 100% accurate
- Always use proper risk management
- Never risk more than you can afford to lose
- Consider using a demo account first
- Seek professional financial advice if needed
Trading involves substantial risk of loss and is not suitable for all investors.
---
## 🔧 Troubleshooting
### "No signals appearing"
- Check if HTF confirmation is enabled but market isn't aligned
- Verify RSI zone isn't too restrictive
- Ensure volume spike isn't filtering out all setups
- Try adjusting EMA lengths for your asset
### "Too many false signals"
- Enable HTF confirmation
- Tighten RSI zone (e.g., 45-55)
- Enable volume spike requirement
- Only trade 70%+ confidence setups
### "Stops too tight/wide"
- Adjust Swing Lookback length
- Modify ATR multiplier for trailing stop
- Consider the asset's volatility
### "Alerts not working"
- Ensure alert is set to "Once Per Bar Close"
- Check indicator is added to the chart
- Verify TradingView notification settings
---
## 📚 Version History
**v1.0 (Current)**
- Initial release
- Multi-timeframe confluence system
- Dynamic risk management
- Real-time HUD dashboard
- Comprehensive alert system
- ATR trailing stops
- Break-even automation
---
## 🤝 Support & Feedback
If you find this indicator helpful:
- ⭐ Star the script on TradingView
- 💬 Share your results and feedback
- 🐛 Report bugs or suggest improvements
- 📖 Share with other traders
---
## 📖 Additional Resources
### Recommended Reading
- "The New Trading for a Living" by Dr. Alexander Elder
- "Swing Trading Using Multiple Timeframes" - Educational articles
- Risk management and position sizing guides
### Learn More About
- Multiple timeframe analysis
- EMA crossover strategies
- RSI divergence and zones
- ATR-based stops
- R-multiple profit management
---
## 📝 License
This indicator is provided as-is for personal trading use.
**Usage Rights**:
- ✅ Use for personal trading
- ✅ Modify for personal use
- ❌ Resell or redistribute
- ❌ Claim as original work
---
## 🎓 Quick Start Checklist
- Add indicator to TradingView chart
- Set your preferred timeframe (1H/4H/Daily)
- Configure HTF setting (one level higher)
- Review default parameters
- Set up entry alerts (HC LONG/SHORT)
- Set up TP and SL alerts
- Test on historical data
- Paper trade first
- Start with small position sizes
- Track your results
---
**Happy Trading! 📊💰**
*Remember: Discipline, patience, and risk management are the keys to long-term success.*

Smart Money Concepts [LuxAlgo]//@version=5
indicator("Gold Price (Korea 1 Don)", overlay=true)
// 설정: 실시간 환율 데이터 가져오기 (FX_IDC:USDKRW)
usdKrw = request.security("FX_IDC:USDKRW", timeframe.period, close)
// 계산 로직
// 트레이딩뷰 XAUUSD는 1트로이온스(31.1034768g) 기준
// 공식: (국제시세 * 환율 / 31.1035) * 3.75
troyOunceToGram = 31.1034768
oneDonGram = 3.75
goldPriceKrw = (close * usdKrw / troyOunceToGram) * oneDonGram
// 화면 표시 (테이블 생성)
var table priceTable = table.new(position.top_right, 2, 2, bgcolor = color.new(color.black, 50), border_width = 1)
if barstate.islast
// 헤더
table.cell(priceTable, 0, 0, "한국 금시세 (1돈)", text_color = color.white, bgcolor=color.new(color.gray, 20), text_size=size.small)
// 가격 표시 (원화 형식으로 콤마 찍어서 출력)
table.cell(priceTable, 0, 1, str.format("{0,number,###,###} 원", goldPriceKrw), text_color = color.yellow, text_size=size.large, bgcolor=color.black)
// 참고용 환율 표시
table.cell(priceTable, 1, 0, "적용 환율", text_color = color.gray, text_size=size.small)
table.cell(priceTable, 1, 1, str.format("{0,number,#,###.##} 원/$", usdKrw), text_color = color.gray, text_size=size.small)

Advance SMC (Milad Tayefi)Smart money indicator which recognizes market structure and produces buy/sell signals.

Smart Money Bot [MTF Confluence Edition]Uses multi-time frame analysis and supply and demand strategy.
Best used when swing trading.

Smart Money COTThis indicator implements the method of analysing COT data as defined by Michael Huddleston (I.E. The Inner Circle Trader). It removes all superfluous information contained in the standard COT reports and focusses only on Commercial speculators using the overall Long-Short positions.
Features
The unique feature of this indicator is its ability to look back over time and provide the following information:
Calculation of the range high and low of the specified lookback range.
Calculation of equilibrium of that range.
Automatic colour coding of net long and net short positions when the Long-Short COT calculation is above or below equilibrium of the lookback range.
Instructions
Use the Daily Timeframe only. You may get unexpected results on other timeframes.
Ensure the asset has COT data available. Script is mainly focused on commodity futures, such as ES, NQ, YM. It has not been tested against Forex.
You will need to define the "Lookback" setting in the script settings. Use the total number of trading days required for your analysis. E.g. if you want a 6 month COT analysis, use the measurement tool to count the quantity of daily candles between now and 6 months ago - use this as your Lookback setting. Adjust as needed for other lookback periods, e.g. 3 months, 12 months etc.
Other Info
The script provides the ability to customise colours in its settings.
Range High and Range Low plots can be disabled in settings.

Smart Money Concepts [Dau_tu_hieu_goc]Credits to LuxAlgo for the SMC Parts.
Edited by Dau_Tu_Hieu_Goc

Institutional level Indicator V5Smart money concept indicator with added VWAP for better understanding for fair price with relation to movement of price.

Smart Money Setup 04 [TradingFinder] Three Drive (Harmonic) + OB🔵 Introduction
The "Three Drive" pattern is a well-known formation in technical analysis, recognized for its ability to signal potential trend reversals in price action. Within the realm of trading, particularly in the context of "Reversal Patterns," the Three Drive pattern holds significance as a reliable indicator of shifts in market sentiment.
🟣 Bullish 3 Drive
This pattern typically manifests at a price bottom, where a sequence of lower lows suggests a prevailing negative trend. However, within the structure of the Three Drive pattern, a notable occurrence unfolds.
The second low breaches the range of the first low, followed by the third low surpassing the range of the second low. These penetrations signify a diminishing selling pressure and an emerging buying interest.
Traders often await the confirmation of the third low surpassing the second low as an entry point, with price targets set at the highs formed within the Three Drive pattern.
🟣 Bearish 3 Drive
Conversely, the Bearish Three Drive pattern emerges at a price top, characterized by a sequence of higher highs indicating an upward trend. Yet, amidst this apparent bullish momentum, a shift occurs.
The second high breaks beyond the range of the first high, succeeded by the third high exceeding the range of the second high. These breaches signify a waning buying strength and a resurgence in selling pressure.
Entry into a trade is often executed after the confirmation of the third high surpassing the second high, with targets set at the lows formed within the Three Drive pattern.
Importance :
Understanding the Three Drive pattern's significance extends beyond mere technical analysis. It bears resemblance to other established patterns, such as the Harmonic Pattern and Ending Diagonal within the Elliott Wave Theory.
Recognizing these parallels aids traders in comprehending broader market dynamics and potential price movements.
🔵 Formation of 3 Drive in Order Block Zone
The convergence of the Three Drive pattern with the concept of the Order Block Zone introduces a nuanced layer to traders' analytical approach.
In "Price Action" methodology, Order Blocks represent areas on the price chart where significant market players, such as institutional traders, have executed notable orders.
These zones often act as barriers, with price encountering resistance or support upon reaching them.
When the Three Drive pattern forms within an Order Block Zone, it signifies a confluence of market dynamics.
The completion of the pattern within this zone suggests a potential reversal in the prevailing trend, augmented by the presence of significant institutional orders.
Traders incorporate these Order Blocks into their analysis to identify probable levels where price may change direction, enhancing the reliability of their trading decisions.
🔵 How to Use :
To effectively utilize the Three Drive pattern within the Order Block Zone, traders seek alignment between the completion of the pattern and the presence of significant Order Blocks.
This convergence enhances the reliability of the pattern's signals, increasing the likelihood of successful trade outcomes.
Bullish Three Drive in Demand Zone :
Bearish Three Drive in Supply Zone :
Settings :
You can set your desired "Pivot Period" via settings for the indicator to identify setups based on it.

Smart money conceptThe indicator tracks the smallest movements of price action. It can monitor and analyze market context, attempting to identify trends within each time frame.
If a candle has its entire body above the previous swing high, it indicates a strong upward momentum. The market is leaning towards an upward direction. If the candle remains within the range of the previous swing high, it signifies weak upward momentum. The market is reluctant to move higher.
If a candle has its entire body below the previous swing low, it reflects a strong downward momentum. The market is leaning towards a downward direction. If the candle remains within the range of the previous swing low, it indicates weak downward momentum. The market is reluctant to move lower.